Analysis of the Mapswipe Tiles – how ‘square’ are they?#
To generate VGI for humanitarian use, project areas are cut into tiles in order for users to search for buildings on aerial imagery. The Mapswipe tiles are created as described by Bing using Level of Detail 18 (task_z = 18 for Mapswipe data). The users assign a ‘Yes’, ‘No’, ‘Maybe’ or ‘Bad Imagery’ to each tile. This information is used to select on positive tiles and create bigger geometries representing a settlement layer. While these tiles look absolutely squared (e.g. in a web map or in mobile applications such as MapSwipe), they DON’T represent the same area.
The web mercator projection distorts the image in a way that objects further away from the equator will continuously appear bigger than they are. So always keep in mind: The area represented by a tile will be getting smaller the further north or south your tile is located. Table 1 shows that the area of projects further away from the equator have smaller areas and smaller side length. Furthermore, the angles will deviate further from rectangular.
| 10836 Chad | 7605 Madagascar | |
|---|---|---|
| Geographical Latitude | 21 ° North | 25 ° South |
| Average Tile X Length [m] | 144.9570 | 138.3959 |
| Average Tile Y Length [m] | 144.0854 | 137.6354 |
| Area average [m²] | 20886.2967 | 19048.1169 |
| Area min [m²] | 20791.6519 | 18921.4767 |
| Area max [m²] | 20949.2044 | 19139.2674 |
| Area range [m²] | 157.5525 | 217.7908 |
| Deviation from 90° angle | ~ 0.01171 ° | ~ 0.0063 ° |
Table 1: Measurements for Mapswipe Tiles.
Figure 1 shows the decrease in size from south to north in project 10836 (Chad) on the northern hemisphere.
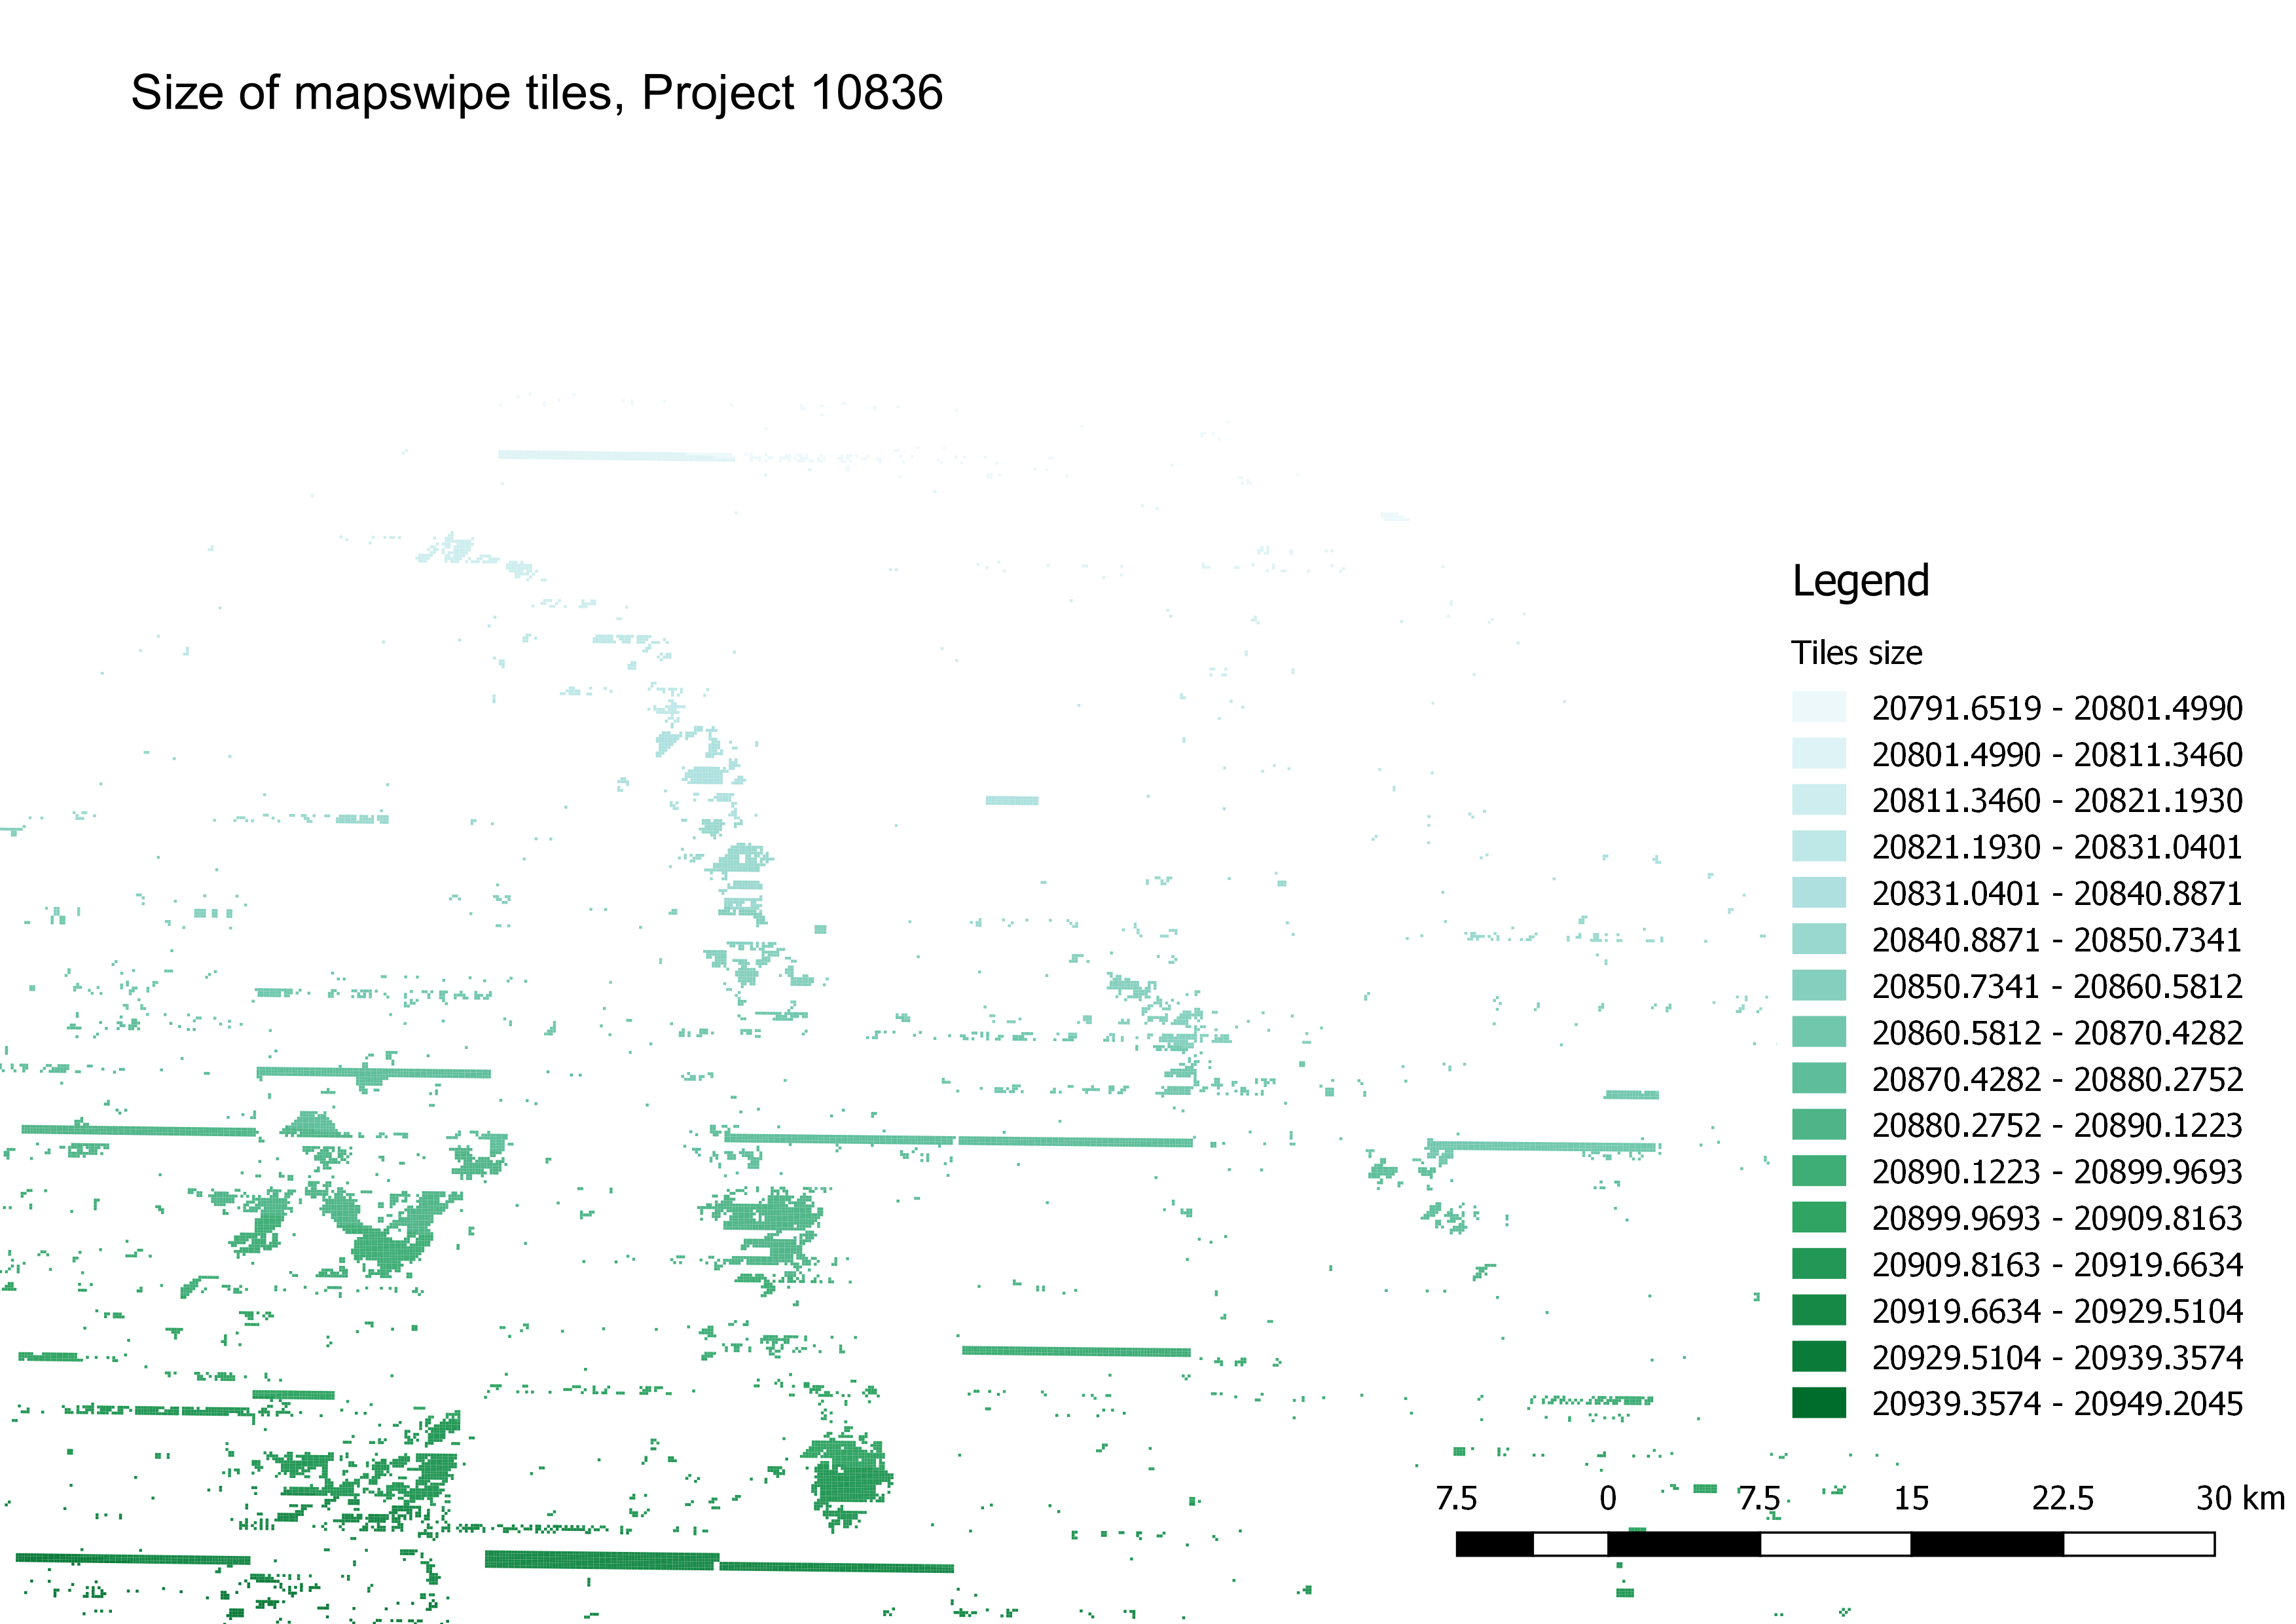
Figure 1: Area in m² of Mapswipe tiles in project 10836. As it is located on the northern hemisphere, tiles further north are smaller.
In the Mapswipe App, each tile has a size of 256x256 pixels. The translation of pixels into meters is depending on geographical longitude and level of details (see Figure 2).
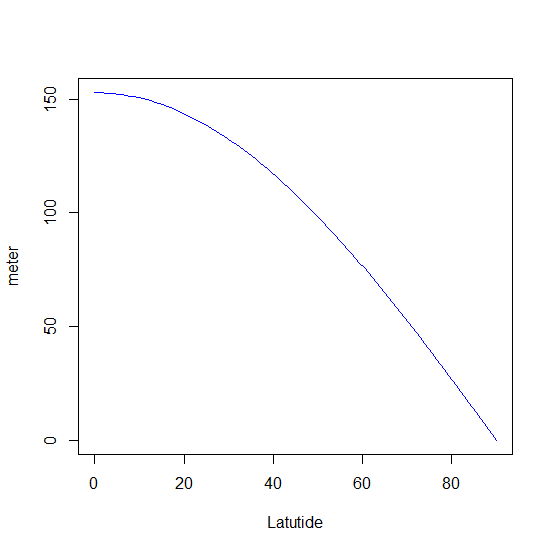
Figure 2: Tile length from pixel to meters: f(latitude, level) = (cos(latitude * pi/180) * 2 * pi * 6378137) / (256 * 2^level) * 256; for level = 18. Values range from 152.8741 m (Equator) to close to 0 m (poles).
As a result of the change in sidelength and inner angles, the area of the tiles decreases with distance from equator as well. Have a look at Figure 3.
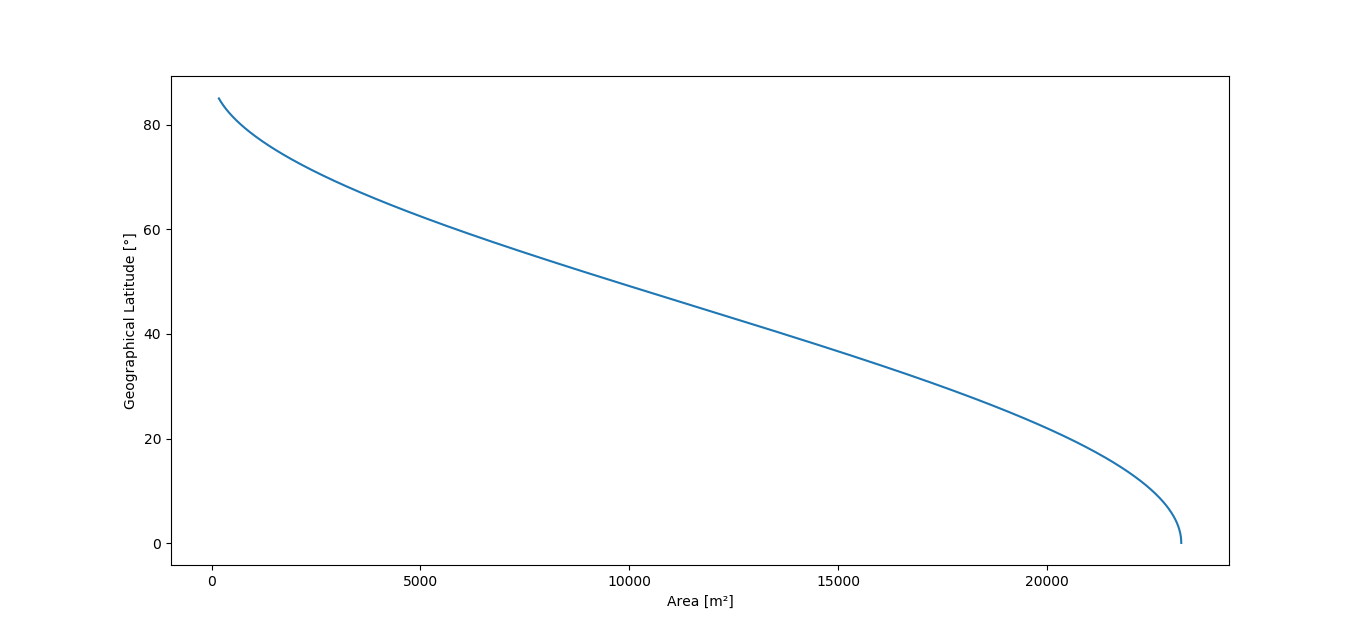
Figure 3 shows the calculated area for the standart level 18 from 90 ° to 0 °.
Summary#
Area and side length of a tile will continuously decrease with distance to the equator
within one project the differences in size depend on the north-south extend of the project
The tile shapes differ from rectangular form the further away they are from the equator
Find a example geojson file with calculated area and side length for given task_y or the Y-coordiantes of the tile center. You can use this file in QGIS or any other GIS software.